What Workforce Analytics Can (and Can’t) Tell You About Employee Performance
Introduction
Workforce analytics has become one of the fastest-growing categories of workplace software, driven largely by the shift to remote and hybrid work. When managers could no longer walk past a desk to see who was working, software stepped in to answer a simpler question: where does the time actually go?
That question turned out to have a lot of value. Data on hours worked, app usage, project time, and meeting load can surface real problems — overloaded teams, inefficient processes, and burnout risk — long before they show up in a resignation letter or a missed deadline.
But somewhere along the way, workforce analytics started being treated as a performance measurement tool, not just a time and workload tool. Dashboards get pulled up in performance reviews. Activity percentages get compared across teams. Screenshots become evidence in disciplinary conversations. This is where things get shaky, because time-tracking data was never designed to answer the question “is this person good at their job?”
This article breaks down what workforce analytics genuinely reveals, what it can’t and shouldn’t be trusted to reveal, and how tools like Time Doctor fit into a healthier, more accurate picture of performance.
Key Takeaways
- Workforce analytics turns raw activity and time data into patterns — it’s excellent at showing what is happening (hours worked, app usage, meeting load, workload distribution) but weak at explaining why it’s happening.
- These tools can reveal bottlenecks, burnout risk, and workload imbalances early, often before a manager would notice them through observation alone.
- They cannot measure judgment, creativity, collaboration quality, or the value of “invisible” work like mentoring or strategic thinking.
- Numbers without context can mislead — a quiet week isn’t always a lazy one, and a busy dashboard doesn’t always mean real progress.
- Tools like Time Doctor, Hubstaff, and ActivTrak differ in how they balance monitoring depth with employee privacy; the right choice depends on team type and culture.
- The most effective approach treats analytics as one input into performance conversations, not a verdict.
What Workforce Analytics Actually Measures
Most workforce analytics platforms pull from a similar set of raw inputs:
- Time data — hours logged, time spent per project or task, start and stop patterns
- Activity data — app and website usage, keyboard/mouse activity levels, idle time
- Visual verification — screenshots or screen recordings, used selectively by some tools
- Calendar and meeting data — time spent in meetings versus focus work
- Attendance data — clock-ins, breaks, shift adherence, GPS for field or mobile teams
None of this is a measurement of skill, output quality, or impact. It’s a measurement of behavior over time. That distinction matters enormously, because behavior and performance are related but not the same thing. A software engineer who spends six hours in their IDE and two developers who spend the same six hours can produce wildly different amounts of value — one might ship a critical fix, the other might spend the time stuck on a problem that needed a five-minute conversation with a teammate.
Workforce analytics is, at its core, a lens on how work happens. Performance is a judgment about whether the work mattered. Good workforce analytics tools are increasingly aware of this gap and are designed to support, not replace, human judgment.
What Workforce Analytics Can Tell You
1. Where time is actually going
Most people — including managers — are bad at estimating how their day breaks down. Analytics tools replace guesswork with data: how much time goes to deep work versus meetings, which projects consume disproportionate hours, and where administrative tasks quietly eat into billable or productive time.
2. Workload imbalances across a team
When some team members are consistently logging far more hours than others on comparable work, that’s a visible, actionable signal. Analytics can flag this before it turns into resentment or burnout.
3. Early burnout and disengagement signals
Extended work hours, shrinking breaks, declining activity after a period of high output, or irregular schedules can all be early indicators of strain. Several modern platforms now build automated alerts around these patterns specifically so managers can intervene early rather than reactively.
4. Process bottlenecks
If a task that should take two hours consistently takes six across multiple team members, that’s rarely an individual performance issue — it usually points to a broken process, unclear requirements, or a tooling problem.
5. Meeting load versus focus time
Calendar-integrated analytics can show how much of a person’s week is consumed by meetings versus uninterrupted work, which is useful for diagnosing why “everyone is busy but nothing is shipping.”
6. Objective data for billing and payroll
For agencies, consultancies, and outsourced teams, accurate time and project tracking directly supports client billing accuracy and payroll — a purely factual, low-controversy use case where the data speaks for itself.
7. Comparative benchmarks
Some platforms now offer benchmarking against similar teams or industries, giving managers external context for whether a pattern (like meeting-heavy weeks) is unusual or simply normal for that type of role.
What Workforce Analytics Can’t Tell You
1. Whether the work was good
A designer who spends four focused hours producing one exceptional concept has likely delivered more value than one who spends eight hours iterating on a mediocre one. Time and activity data can’t distinguish the quality of output — only the quantity of effort and time spent.
2. The value of thinking time
Some of the most important parts of many jobs — planning, problem-solving, reading, thinking through a hard decision — don’t look like “activity” on a screen. A quiet hour with no mouse movement might be someone’s most productive hour of the week, and analytics tools have no reliable way to tell that apart from disengagement.
3. Collaboration and mentorship
Helping a colleague debug an issue, giving thoughtful feedback on a teammate’s draft, or de-escalating a tense client call rarely shows up as a tracked “task.” These contributions are often some of the most valuable things an employee does, and they’re largely invisible to time-tracking systems.
4. Context behind the numbers
A drop in tracked hours could mean disengagement — or it could mean someone finally streamlined a process and now finishes the same work in less time. Data shows the pattern; it doesn’t explain the cause. That still requires a conversation.
5. Creativity, judgment, and decision quality
Whether a strategic call was the right one, whether a piece of writing actually persuades a reader, or whether a proposed solution is elegant or just functional — these require human evaluation. No dashboard metric substitutes for expert judgment here.
6. Motivation and intent
Two employees might show identical activity data for very different reasons — one because they’re genuinely engaged, another because they know they’re being watched. Analytics measures behavior, not the motivation behind it, which means it can be gamed or misread in either direction.
7. Long-term potential
Performance data captures a snapshot of recent behavior. It says very little about a person’s trajectory, growth, adaptability, or the skills they’re quietly building that haven’t yet shown up in output.
A Look at the Tools: Time Doctor and Others
Workforce analytics is a crowded category, and tools differ meaningfully in how much they monitor, how transparent that monitoring is to employees, and how much interpretation they layer on top of raw data.
Time Doctor
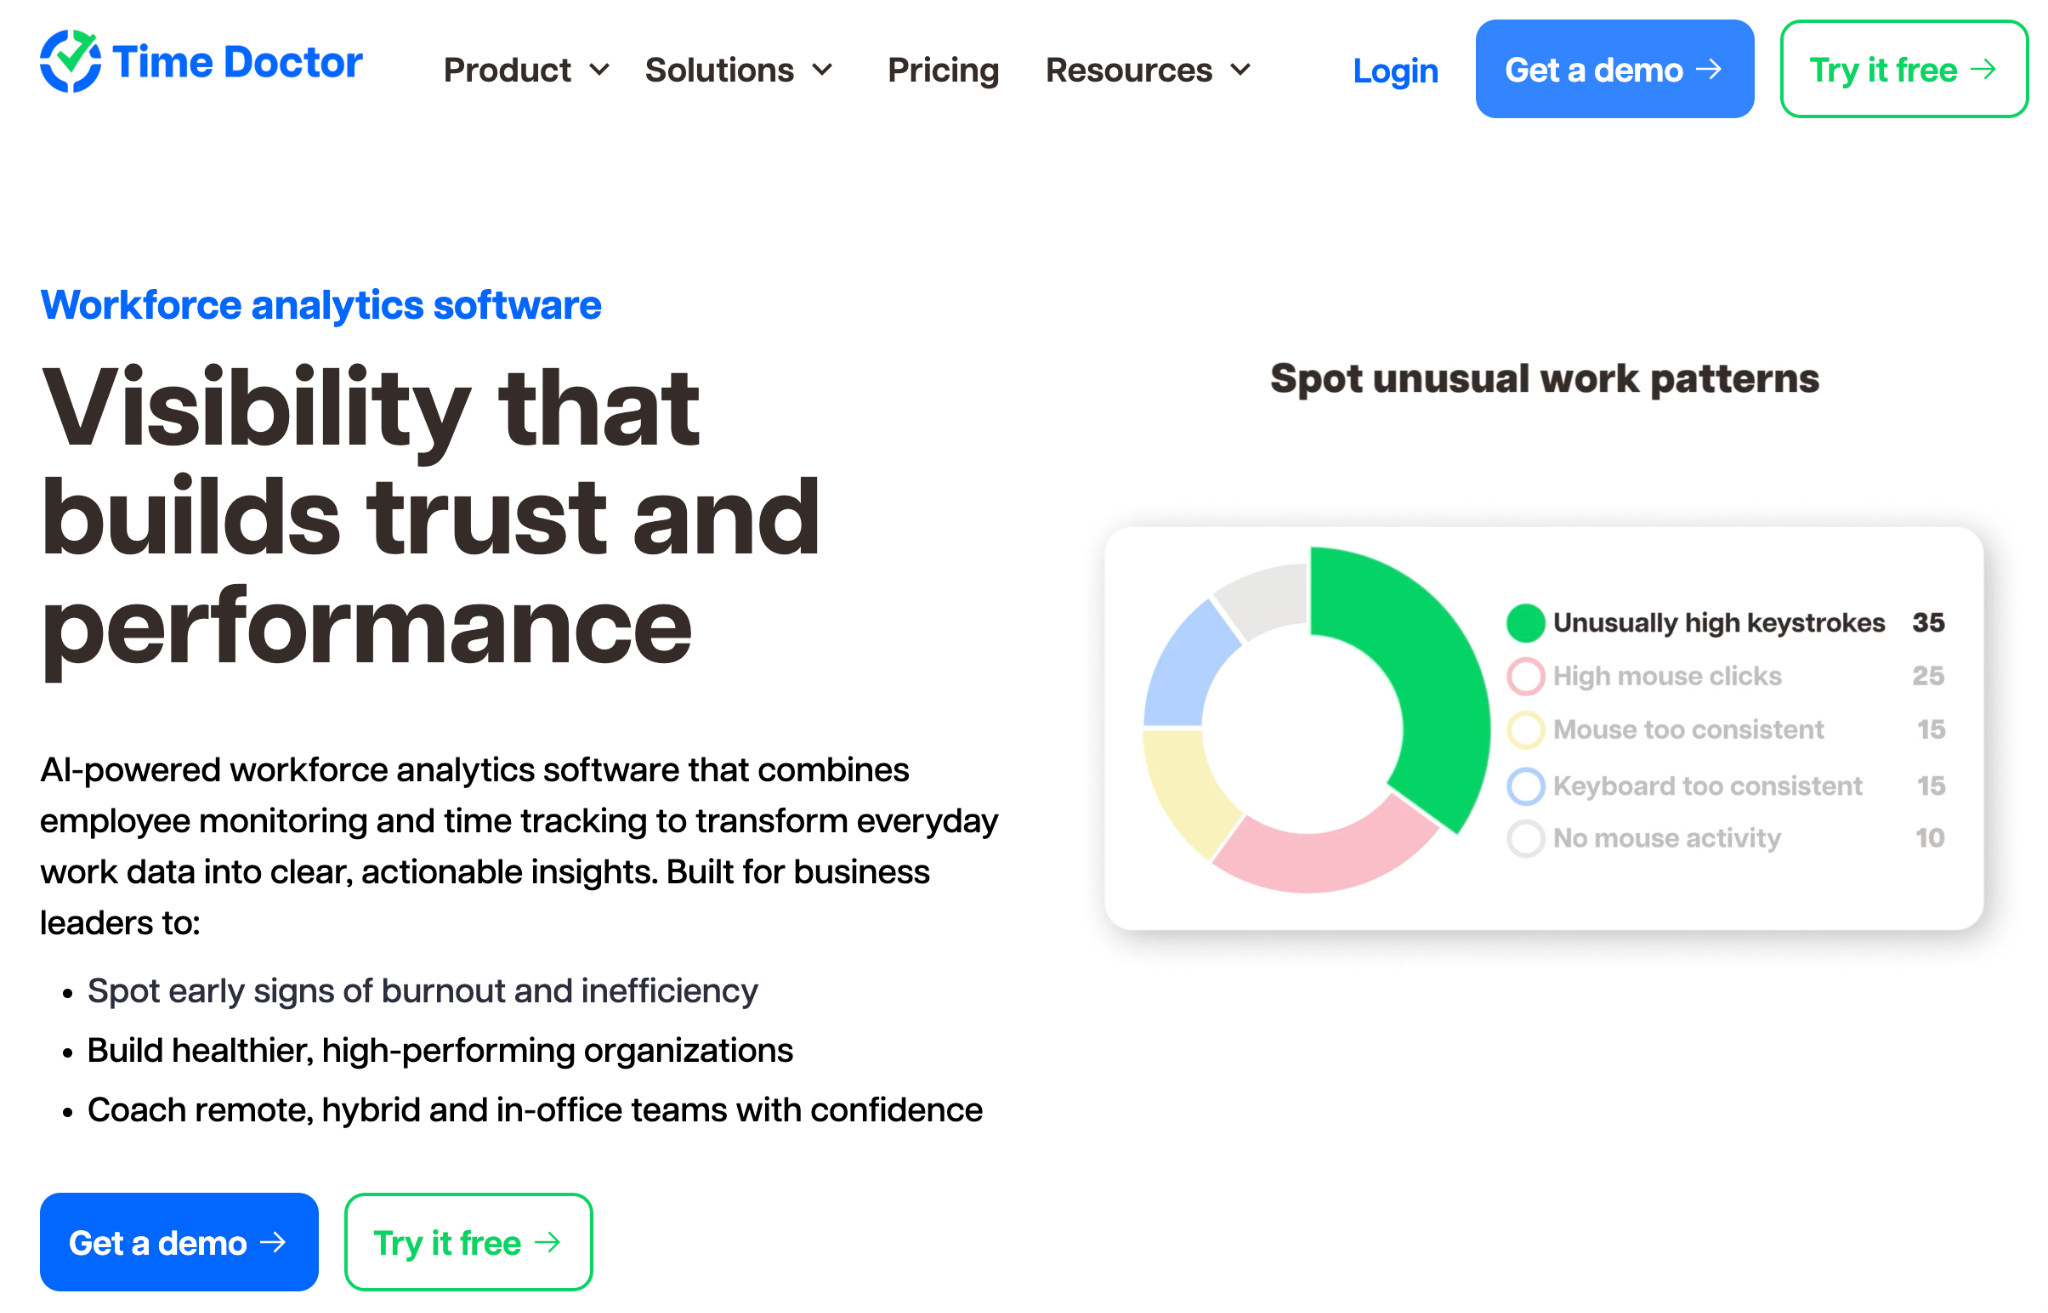
Time Doctor is one of the more established platforms in this space, positioned specifically as a combination of time tracking and workforce analytics for remote, hybrid, and in-office teams. Its feature set includes:
- Time and project tracking with reporting broken down by task, project, and client, useful for billing accuracy and payroll integrations
- Activity monitoring, including optional screenshots and screen recordings, with privacy and role-based access controls so employees can also see their own data rather than only having it visible to managers
- Work-life balance alerts, designed to flag extended hours, irregular schedules, or reduced breaks before they turn into burnout
- Benchmarks AI, which compares a team’s productivity patterns against similar peer groups by industry or team size, giving managers external context instead of relying purely on internal comparisons
- Meeting Insights, which shows how much meeting time is cutting into focus time across a team
- Unusual Activity Reports and real-time alerts that flag workload strain or irregular patterns as they emerge, rather than after a review cycle
- Compliance features, including support for standards like SOC 2, GDPR, and HIPAA, which matters for regulated industries such as healthcare and BPO
- Integrations with payroll, project management, and HR tools to reduce manual reconciliation
Time Doctor is explicit that it’s built to support performance conversations with data rather than replace manager judgment, and it gives employees visibility into their own tracked data — a design choice aimed at building trust rather than one-way surveillance. Like any monitoring-heavy tool, some of its deeper analytics and AI features sit behind higher-tier plans, and organizations should weigh how much screenshot- or activity-based monitoring fits their culture before rolling it out broadly.
Other tools worth knowing
Hubstaff takes a similar time-tracking-plus-analytics approach, with a strong emphasis on connecting tracked time directly to timesheets, project budgets, invoicing, and payroll. It also offers benchmarking and utilization metrics through its Insights features, making it a common comparison point for teams evaluating Time Doctor.
Using Analytics Without Misusing It
The organizations that get the most value from workforce analytics tend to follow a few consistent principles:
- Use it to ask better questions, not deliver final answers. A dip in a benchmark score should prompt a conversation, not a conclusion.
- Combine quantitative data with qualitative input. Peer feedback, project outcomes, and client satisfaction should sit alongside activity data in any performance discussion.
- Be transparent with employees about what’s tracked and why. Tools that give employees visibility into their own data tend to build more trust than those used purely for one-way oversight.
- Watch for false signals. Slower weeks, thinking time, and process improvements can all look like “lower productivity” in raw data when they’re actually healthy or even positive.
- Set boundaries on how monitoring-heavy features (like screenshots) are used, particularly for roles where deep, uninterrupted thinking is the job.
Conclusion
Workforce analytics is genuinely useful — it replaces guesswork with visibility into workload, time allocation, and early risk signals that would otherwise go unnoticed until they became real problems. But it measures behavior, not value, and the gap between the two is exactly where good management still has to do the work. The tools can tell you how many hours a team spent on tax planning, website maintenance and development, mapping out every minute spent on research and documentation. What they can’t tell you is if the team uncovered a critical loophole or just spun their wheels on dead ends. Ultimately, whether those tax planning hours mattered, or if the resulting strategy was brilliant, is still, and probably always will be, a human judgment call.
FAQs
Is workforce analytics the same as employee monitoring? They overlap but aren’t identical. Employee monitoring usually refers to the underlying tracking (activity levels, screenshots, app usage), while workforce analytics refers to turning that raw data into patterns, trends, and insights that managers can act on.
Can workforce analytics data be used to fire someone? Legally and practically, it’s risky to base termination decisions solely on activity metrics, since they don’t capture output quality or context. Most HR and legal guidance recommends using this data as supporting evidence alongside other performance indicators, not as the sole basis for disciplinary action.
Does using tools like Time Doctor hurt employee trust? It depends heavily on implementation. Tools that are transparent, give employees access to their own data, and are framed around workload support rather than surveillance tend to be received far better than those rolled out silently or used punitively.
How is workforce analytics different for remote versus in-office teams? The core metrics are similar, but remote teams rely more heavily on digital activity data since there’s no physical presence to observe, while in-office analytics may lean more on attendance, scheduling, and space utilization data.
What’s the biggest mistake companies make with these tools? Treating raw metrics — like “productivity percentage” — as a direct proxy for performance. These numbers reflect activity patterns, not the value or quality of the work produced, and treating them as equivalent leads to unfair evaluations and eroded trust.
Are there workforce analytics options with lighter monitoring? Yes. Some platforms focus more on aggregate behavioral trends and benchmarking with minimal or no screenshot capture, which may suit teams that want visibility without granular individual surveillance. The right fit depends on industry, compliance needs, and company culture.